Introduction
If you’ve been writing JavaScript for even a few weeks, you’ve probably typed console.log() more times than you can count. It’s the first thing most of us learn, and honestly, it works just fine for basic stuff. But here’s the thing — the browser console is actually much more powerful than most developers realize.
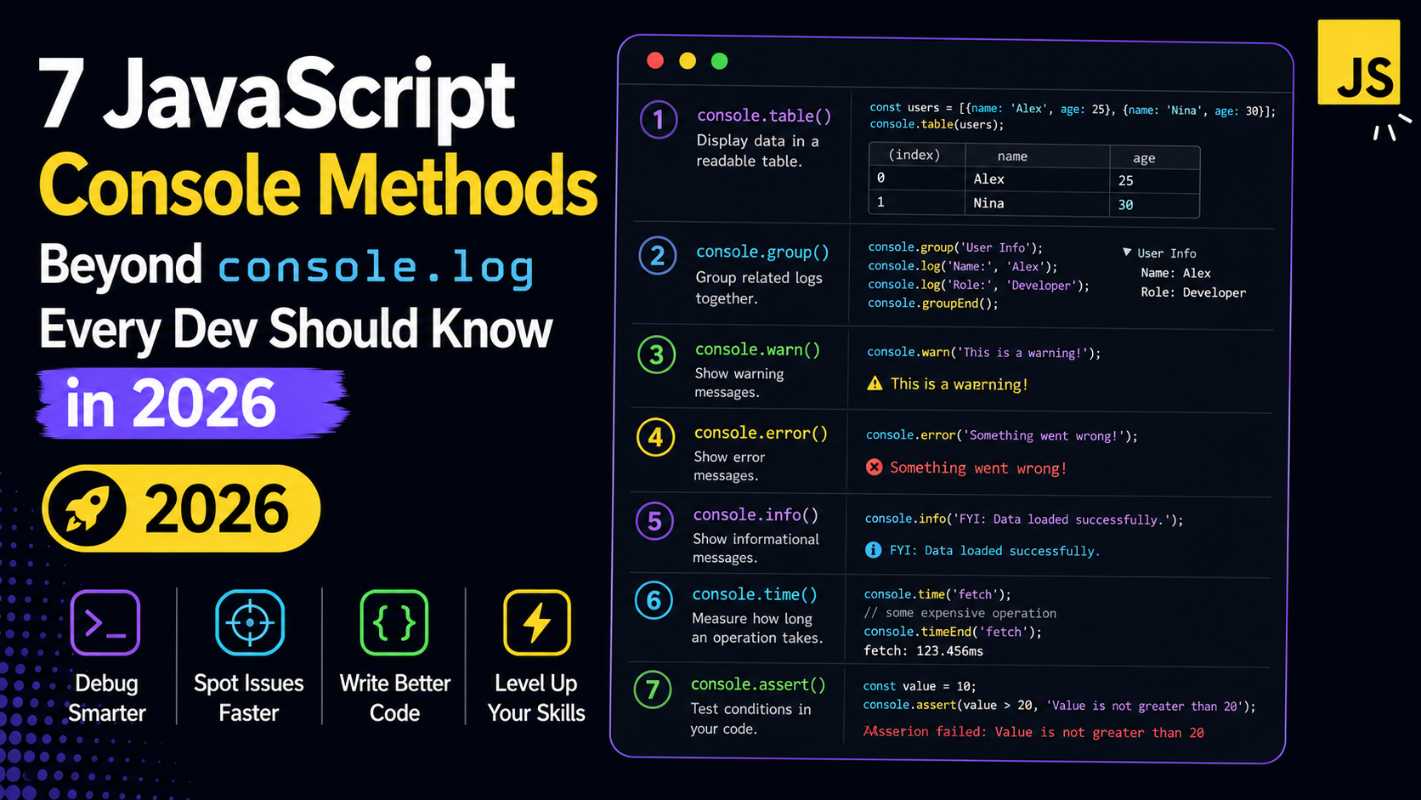
There are several JavaScript console methods that sit right there, unused, while developers keep stuffing everything into console.log. These methods can help you group output, track time, display tables, and even warn yourself when something looks off. If you’re still relying only on console.log, you’re leaving a lot of useful tools on the table.
This guide walks you through 7 JavaScript console methods you probably haven’t used much — but should. Each one is practical, easy to understand, and genuinely helpful in real projects. No fluff, just things you can actually use.
Why You Should Go Beyond console.log
Let’s be real. console.log is a hammer, and sometimes we use it when we need a scalpel.
When your app gets bigger — more functions, more nested data, more async calls — your console turns into a wall of text. You start scrolling endlessly trying to figure out what printed where. It gets messy fast.
That’s exactly where the other JavaScript console methods shine. They were built to help you debug smarter, not harder. Browsers like Chrome and Firefox have supported most of these for years, yet most tutorials only ever mention console.log. That ends today.
1. console.warn() and console.error() – Give Your Logs Context
These two are probably the most overlooked JavaScript console methods among beginners. They work almost identically to console.log, but they add color and icons to your output.
console.warn("Watch out! This value might be undefined.");
console.error("Something broke here. Check the response.");
console.warn prints with a yellow background and a warning icon. console.error prints in red with an error icon. That visual difference is surprisingly helpful when you’re scanning a busy console.
More importantly, console.error also prints a stack trace, which tells you exactly where in your code the message was triggered. This saves you from hunting around manually.
Think of it this way — if console.log is a plain text message, console.warn is a yellow sticky note, and console.error is a red alarm. Use them based on the severity of what you’re watching.
2. console.table() – Display Arrays and Objects Like a Pro
This one is genuinely one of my favorite JavaScript console methods. If you’re working with arrays of objects — say, a list of users fetched from an API — console.table() renders them as a clean, sortable table in the browser console.
const users = [
  { name: "Rohit", age: 24, city: "Mumbai" },
  { name: "Priya", age: 29, city: "Delhi" },
  { name: "Arjun", age: 22, city: "Pune" }
];

console.table(users);
Instead of seeing a collapsed object you have to click open, you get a proper table with column headers. You can even click the columns to sort them. It makes reading structured data so much easier.
This is especially useful when you’re debugging API responses. Instead of opening each object individually inside console.log, you get everything laid out cleanly in one shot.
3. console.group() and console.groupEnd() – Organize Your Logs
Here’s another pair of JavaScript console methods that most developers ignore — until their console becomes impossible to read. console.group() lets you create collapsible groups of log output, which is perfect when you have related logs you want to keep together.
console.group("User Authentication Flow");
console.log("Step 1: Checking credentials");
console.log("Step 2: Generating token");
console.log("Step 3: Storing session");
console.groupEnd();
In the browser console, this creates a collapsible section labeled “User Authentication Flow.” You can expand or collapse it with one click. No more digging through a flat stream of unrelated messages.
You can also nest groups inside each other, which is great for debugging multi-step processes or recursive functions. console.groupCollapsed() does the same thing but starts collapsed by default — useful when you want the logs available but not immediately in your face.
4. console.time() and console.timeEnd() – Measure Performance Simply
Among all the JavaScript console methods available, this pair is one of the most underused performance tools out there. console.time() starts a timer, and console.timeEnd() stops it and prints how long it took.
console.time("fetchData");

// Simulate an API call
setTimeout(() => {
  console.timeEnd("fetchData"); // Output: fetchData: 302.45ms
}, 300);
You give the timer a label (just a string), and it tracks time between the two calls with that label. This is genuinely useful when you want to compare the speed of two different approaches — like checking whether a for loop or forEach is faster for a specific task in your app.
It’s not a replacement for proper profiling tools, but for quick checks during development, it’s perfect. No imports, no libraries, just one line each.
5. console.assert() – Log Only When Something Goes Wrong
This one is a bit different from the other JavaScript console methods. console.assert() only prints a message if the first argument evaluates to false. If the condition is true, nothing happens.
const userAge = 15;
console.assert(userAge >= 18, "User is under 18. Access should be restricted.");
In this example, because userAge is 15 (which is less than 18), the assertion fails and the message prints. If userAge were 21, nothing would appear in the console at all.
This is great for validation checks during development. Instead of wrapping console.log inside an if statement every time, you can use assert to only log when a specific condition breaks. It keeps your debugging code shorter and more intentional.
Just remember — console.assert doesn’t throw an error or stop execution. It’s purely for logging purposes.
6. console.count() – Track How Many Times Something Runs
Out of all the JavaScript console methods, this one surprises developers the most because it seems almost too simple. console.count() keeps a running count of how many times it’s been called with a particular label.
function handleClick(buttonName) {
  console.count(buttonName);
  // rest of your logic
}

handleClick("Submit");
handleClick("Submit");
handleClick("Cancel");
handleClick("Submit");
The output would look like:
Submit: 1
Submit: 2
Cancel: 1
Submit: 3
This is incredibly handy when you’re debugging event listeners or trying to figure out if a function is getting called more times than expected. Maybe a button click handler is firing twice — console.count will catch that immediately.
console.countReset() can reset the counter back to zero if you need to start fresh at a certain point in your code.
7. console.dir() – Inspect DOM Elements the Right Way
The last of the JavaScript console methods in this guide is console.dir(). It might look similar to console.log at first, but there’s an important difference when you’re working with DOM elements.
const button = document.querySelector("#submitBtn");
console.log(button);   // Shows HTML markup
console.dir(button);   // Shows the DOM object and all its properties
When you console.log a DOM element, the browser shows the HTML representation of it — the actual markup. When you use console.dir, it shows the element as a JavaScript object with all its properties and methods expanded. Things like classList, id, style, innerHTML, parentElement, etc.
For front-end developers, this is a much better way to inspect what’s actually attached to an element in memory, rather than just looking at its HTML structure.
It’s especially useful when you’re debugging event listeners, custom data attributes, or unexpected style overrides. The difference between these two JavaScript console methods becomes very clear once you use them side by side.
How These Console Methods Work Together in a Real Project
Let me give you a quick example of how a few of these JavaScript console methods can work together in a real scenario.
Say you’re building a form with a login flow. Here’s how you might use multiple methods:
console.group("Login Process");

console.time("loginDuration");
console.count("loginAttempt");

const username = "";
console.assert(username !== "", "Username is empty! Validation failed.");

console.warn("Rate limiting: Too many requests detected.");
console.timeEnd("loginDuration");

console.groupEnd();
This single block gives you grouped, timed, counted, and validated output — all in one clean section of your console. Compare that to five separate console.log calls scattered randomly. It’s a different experience entirely.
Learning to use these JavaScript console methods together naturally is what separates a developer who just “gets things working” from one who writes maintainable, debuggable code.
Quick Reference Table for All 7 JavaScript Console Methods
| Method | What It Does |
|---|---|
console.warn() | Prints a yellow warning with stack trace |
console.error() | Prints a red error with full stack trace |
console.table() | Displays arrays/objects as sortable tables |
console.group() | Creates collapsible groups in console |
console.time() | Starts a named performance timer |
console.assert() | Logs only when a condition is false |
console.count() | Counts how many times a label is hit |
console.dir() | Shows a DOM node as a JS object |
These JavaScript console methods are all available natively in modern browsers — no setup or installation required.
Common Mistakes Developers Make With Console Methods
Even experienced developers sometimes misuse these tools. Here are a few things worth keeping in mind.
First, don’t leave console.time() calls in production code. They add minimal overhead, but it’s just messy practice. Use them during development and clean up before deploying.
Second, console.assert() doesn’t throw errors. A lot of beginners expect it to stop code execution like a real assertion library might. It won’t. It just logs.
Third, console.table() works best with flat arrays of objects. Deeply nested data structures don’t render as cleanly — you might still need console.log for those cases.
Understanding the limits of these JavaScript console methods is just as important as knowing how to use them.
ely useful as reference material beyond what any single article can cover.
Final Conclusion
The browser console is way more capable than most developers give it credit for. While console.log gets the job done for simple tasks, these 7 JavaScript console methods open up a whole new level of clarity and control in your debugging workflow.
From grouping related logs with console.group(), to timing performance with console.time(), to cleanly displaying data with console.table() — each of these tools fills a real gap that console.log alone can’t cover.
Start small. Pick two or three of these JavaScript console methods and try using them in your next project. You’ll quickly notice how much cleaner your debugging sessions become. It doesn’t require any new library or tool — everything covered here is already sitting in your browser, waiting to be used.
Good code isn’t just code that works. It’s code you can understand, trace, and fix quickly when something breaks. These methods help you get there.